


MTD18348 Memorandum
FROM: Mike Giroux and Andrew C. Hogg
DATE: 1/19/2022
RE: Motion for Release of MTD18348 spring durum wheat with supporting documentation.
RECOMMENDATION: Public, protected
NAME: TBD
Contributors:
- Dr. Mike Giroux and Mr. Andy Hogg, MSU Bozeman, MT
- Dr. Pat Carr and Dr. Jed Eberly, MSU-CARC, Moccasin, MT
- Dr. Chengci Chen, Ms. Calla Kowatch-Carlson, Ms. Samantha Hoesel, and Dr. Frankie Crutcher, MSU-EARC, Sidney, MT
- Ms. Peggy Lamb and Ms. Kyla McNamara, MSU-NARC, Havre, MT
- Dr. Ken Kephart and Ms. Valerie Smith, MSU-SARC, Huntley, MT
- Dr. Justin Vetch and Ms. Elizabeth Simmons, MSU-WTARC, Conrad, MT
- Mr. Doug Holen, MSU Foundation Seed, Bozeman, MT
- Mr. Craig Cook, 2nd Nature Research, LLC, Bozeman, MT
- Dr. Linda Dykes, USDA-ARS, Fargo, ND
- Dr. Xianming Chen USDA-ARS, Pullman, WA
- Dr. Li Huang, MSU, Bozeman, MT
- Dr. Zhaohui Liu, NDSU, Fargo, ND
Pedigree:
Alzada/Strongfield//Brigade/Carpio
‘Alzada’-Westbred, LLC, 2004
‘Alzada’ was developed from the cross Mohawk/Kofa and released by Westbred, LLC, Bozeman, MT. Alzada is a semi-dwarf, spring durum wheat adapted to drier climates with excellent end-use quality traits (high yellowness, high gluten strength, and good color stability) and normal cadmium content. Alzada heads and matures ~5 days early than other commonly grown durum cultivars. Alzada has been the most widely grown durum wheat in the “Golden Triangle” of Montana the last 15 years. •
‘Strongfield’- Agriculture and Agri-food Canada (AAC), 2004
'Strongfield' spring durum wheat (Reg. no. CV-1000, PI 641223) was developed by the AAC, Swift Current, SK. It has high yield, good end-use quality traits, and carries the low cadmium trait. Strongfield was selected from the cross 'AC Avonlea'/DT665 made in 1994 and developed using a modified pedigree breeding method. AC Avonlea (Clarke et al., 1999) is from the AAC program and DT665 derives from the cross 'Kyle'/'Nile'. Nile was obtained from the International Centre for Agricultural Research in the Dry Areas, Aleppo, Syria and Kyle (TownleySmith et al., 1987) is from AAC.
Clarke, J.M., McCaig, T.N., DePauw, R.M., Knox, R.E., Clarke, F.R., Fernandez, M.R., and Ames, N.P. 2006. Registration of ‘Strongfield’ Durum Wheat. Crop Science, 46(5), 2306-2307. https://doi.org/10.4141/P04-119
‘Brigade’- AAC, 2008
‘Brigade’ was selected from the cross DT513/DT696 made in 1999. Brigade has good yield, high gluten strength, good straw strength and fusarium resistance better than many Canadian durum varieties and carries the low cadmium trait. DT513 (DT625/DT612) was developed at the Crop Development Centre, University of Saskatchewan, and DT696 (DT618/DT 637//Kyle) derives from the AAC breeding program.
Clarke, J.M., Knox, R.E., DePauw, R.M., Clarke, F.R., Fernandez, M.R., McCaig, T.N., Singh, A.K. 2009. Brigade Durum Wheat. Canadian Journal of Plant Science, 89(3) https://doi.org/10.4141/CJPS08168
‘Carpio’- North Dakota State University (NDSU), 2012
‘Carpio’ was developed by NDSU using the pedigree breeding method from the cross D95580/D95595 made in fall 1999. Carpio has high gluten index, equal to Alzada, high grain yield potential, disease resistance, and excellent end-use qualities. Carpio has normal cadmium content. Elias, E.M., Manthey, F.A., and AbuHammad, W.A. 2015. Registration of ‘Carpio’ Durum Wheat. Journal of Plant Registrations 9(1):78. https://doi.org/10.3198/jpr2014.05.0030crc
Selection History
MTD18348 was developed from a four-way cross between Alzada, Strongfield, Brigade, and Carpio. In 2015, Strongfield was crossed with Alzada and Brigade was crossed with Carpio. In early spring of 2016, the Alzada/Strongfield x Brigade/Carpio F1s were crossed. The F1 offspring from this cross was then advanced in the greenhouse and field by single seed descent to the F5 generation at which point a whole head was harvested. In 2018, 214 Alzada/Strongfield//Brigade/Carpio F5:6 lines were planted in spaced head-rows (15 seeds/5 ft row) in Bozeman, MT at the Post Agronomy Farm and the best agronomic rows were visually selected and threshed using a Vogel thresher. Visual selection focused on selecting plots with high productive tillers, high straw strength, moderate height, low disease symptoms, large heads, high vigor, and normal or early maturity. Harvested grain was assessed for protein content and lines with protein below 13.5% were discarded. In 2019, MTD18348 was included in the Bozeman Durum Preliminary Yield Trial which consisted of 550 F5:7 entries. Each entry was grown as a single nonreplicated 2-row plot (2 x 10 ft) with check entries Joppa and Alzada included every 25 rows at the Post Agronomy Farm under dryland and irrigated conditions. Lines were evaluated for agronomic traits (height, heading date, maturity date, and grain yield) and quality traits (protein, seed size, and yellowness) and plots from the irrigated trial were harvested with a binder and Vogel thresher for seed stock. Based on yield performance (4th highest average yield), protein content and maturity date, MTD18348 was advanced for statewide testing in 2020. A bulk DNA sample from F5:8 greenhouse plants was genotyped for cdu1 using published protocols and MTD18348 was determined to carry the low cadmium accumulation allele. In 2020, MTD18348 (F5:8) was grown at eight locations across the state to evaluate agronomics and quality traits were assessed by the USDA quality lab in Fargo, ND. Locations tested were Bozeman Post Agronomy Farm (irrigated and dryland), SARC (dryland), EARC (irrigated and dryland), CARC (dryland), and NARC (dryland), and in Conrad, MT (dryland, 2nd Nature LLC). In 2020, MTD18348 was the highest yielding line averaged over all on-station dryland locations (64.5 bu/ac, p=0.043) and at EARC dryland (55.4 bu/ac, p=0.304). MTD18348 had the highest percentage of large seeds (76.7), high yellowness (b*=31.5), and high gluten strength (Gluten Index=96) in 2020. MTD18348 (F5:9) was tested again in the Montana 2021 State Durum Trials at the same locations as 2020 with the exception that the trial in Conrad was planted at WTARC, and four off-station trials were planted at Loring, Turner, Chester, and Dagmar. In 2021, MTD18348 was the second highest yielding line across all on-station dryland locations (45.2 bu/ac, p=0.063) and the highest yielding line at EARC dryland (45.6 bu/ac, p<0.001). In 2021, MTD18348 again had a high percent of large seeds (52.1%), high semolina yellowness (b*=32), and high gluten strength (Gluten Index=96). MTD18348 was selected for varietal release due to its high yield potential in the durum growing regions of the state, its excellent quality characteristics, low grain cadmium accumulation, and tolerance to fungal leaf spot disease.
Purification of seed stock
MTD18348 was developed using the single seed descent method from 2016-2018. A single F5 head was harvested from the greenhouse and F5:6 seed was planted in a head-row in spring 2018. In 2018, a F5:6 head-row was selected and harvested by binder and threshed with a Vogel for seed stock. In 2019, a 2’x10’ plot of F5:7 was planted under irrigation and harvested by binder and threshed with a Vogel. In 2020, a 4 x 30 ft plot of F5:8 was planted for initial seed increase. This plot was rogued for off types throughout the growing season and harvested using a clean Wintersteiger plot combine. MTD18348 (F5:9) was increased as breeders seed in 2021 in Bozeman, MT. A 0.2-acre increase was grown under irrigation and the field was rogued multiple times throughout the year to remove contaminants and offtypes. Seed from the breeder’s increase plot was harvested with a clean Wintersteiger plot combine by MSU foundation seed. Foundation seed (F5:10) will be raised in 2022 in Bozeman, MT, followed by registered seed in 2023 and certified seed in 2024. Expected availability to the public in 2025.
Agronomic characterizations
MTD18348 is a standard height spring durum wheat (Triticum turgidum ssp. durum) developed at MSU that carries the cdu1 allele for low cadmium accumulation. MTD18348 is approximately 33 inches tall under all dryland conditions, similar to NDSU varieties such as Tioga and ND-Riveland (Table 2) and has white glumes and black awns. MTD18348 has a heading date (June 28th) a day later than Tioga and NDRiveland, two days later than Joppa, and six days later than Alzada under dryland conditions (Table 2). Under only dryland conditions (2020-21, 12 loc-year, no off-station) MTD18348 (54.8 bu/ac) was the top yielding entry and yielded significantly higher than Divide (50.3 bu/ac), Joppa (50.4 bu/ac), and Tioga (50.1 bu/ac) (Table 2). In 2020, MTD18348 (64.5 bu/ac) yielded significantly more than Alzada (58.4 bu/ac) under all dryland locations (n=6). Under all locations and conditions (2020-21, 16 loc-year, no off-station) MTD18348 (67.4 bu/ac) yielded more than the top grown cultivars Divide (64.0 bu/ac), and 5 Tioga (63.5 bu/ac) (Tables 3). Over two years at EARC dryland (2020-21) MTD18348 was the highest yielding line, though not significantly, with an average yield (50.5 bu/ac) higher than Divide (41.8 bu/ac), Joppa (41.4 bu/ac), Tioga (41.3 bu/ac), and ND-Riveland (45.4 bu/ac) (Table 4). At the off-station Dagmar 2021 trial MTD18348 was the highest yielding line by 3 bu/ac, though not statistically so (Table 5). At the Loring off-station trial in 2021 MTD18348 was the highest yielding line and significantly higher than the top grown cultivars (Table 6). MTD18348 was the third highest yielding line in the Chester off-station trial which was equal to the highest yielding line (Table 7).
Quality characteristics
Averaged over two years and all locations (16 loc-years), MTD18348 had grain protein content (14.8%), test weight (60.5 lb/bu), and grain ash (1.56%) comparable to top grown lines but had a significantly higher falling number (481.6 sec) (Table 8). Compared to the top grown cultivars Divide, Joppa, and NDRiveland, MTD18348 had a significantly higher percent of large seeds (65.3%), the lowest percent of small seeds (8%), and one of the largest individual seed weights (41 mg) (Table 9). MTD18348 had a semolina yield (60.9%) comparable to Joppa and Alzada but significantly higher than Divide and NDRiveland (Table 10). Semolina from MTD18348 had similar protein (13.1%) and ash content (0.66%) as top grown cultivars (Table 10). MTD18348 has excellent gluten strength (Gluten Index=96) like Alzada, ND-Riveland, and Carpio which is higher than Divide (78) and Joppa (88) (Table 11). MTD18348 has yellower (b*=31.8) semolina than Divide and Joppa but equal to Carpio, Alzada, and ND-Riveland (Table 11).
Disease evaluations
Fusarium head blight susceptibility was evaluated in 2021 at EARC and MTD18348 performed similarly as top grown cultivars in terms of severity, index, and fusarium damaged kernels having moderate susceptibility (Table 12). MTD18348 was found to be resistant to the most prevalent stem rust race in Montana TCMLK (Table 13). MTD18348 was evaluated for leaf spot caused by Stagonospora nodorum and Pyrenophora tritici-repentis and was resistant to the predominant race of both pathogens while having sensitivity to ToxA and moderate susceptibility to Ptr race 5 (Table 14). MTD18348 was evaluated for resistance/susceptibility to stripe rust in 2021 at Mt. Vernon, WA and had an intermediate reaction at the seedling stage (5) similar to top grown cultivars but had an intermediate reaction (5) at the adult stage, indicating this line may not have high-temperature adult plant resistance (HTAP) to stripe rust as seen in other lines (Tables 15).
Statistical analysis
For yield data across years and locations, the entry mean from each location/year was considered a replicate and was analyzed as a randomized complete block design (RCBD) using PROC GLIMMIX (SAS v9.4). For data from individual on-station locations in one year, 3 replicates per entry were analyzed as an alpha lattice design using PROC GLIMMIX (SAS v9.4). For data from individual offstation locations in one year, 3 replicates per entry were analyzed as a RCBD using PROC GLIMMIX (SAS v9.4). For quality data, each location-year was considered as a replicate and analyzed as a RCBD using PROC GLIMMIX (SAS v9.4). A protected LSD was used to determine significant differences between entries at the α=0.05 level. For the entry Alzada only data from 2020 was used in the quality analysis. Environmental conditions were much drier and hotter in 2021 compared to 2020.
MTD18348 Traits of Interest
- Very high yield potential
- Low grain cadmium accumulation
- Very high protein strength
- Excellent semolina quality
- Fungal leaf spot tolerance
- Good test weight and larege seed size
- High grain protein
Table 1. 2021 Montana Variety Share of Planted Acres3 (2021 MWBC Durum Variety Survey conducted by the National Agricultural Statistics Service)
Cultivar |
2021 %1 |
2020 %1 |
| Divide | 16.9 | 8.8 |
| Alzada | 16.0 | 35.2 |
| ND-Riveland | 13.4 | 1.0 |
| Joppa | 12.3 | 22.5 |
| Transcend | 10.7 | 5.3 |
| Carpio | 3.3 | 1.0 |
| Other2 | 27.4 | 26.2 |
1Percentage may not add to 100 due to rounding
2Includes varieties with less than 1% of acreage in 2021 and unknown varieties
31,000 acres (1 acre = 0.405 hectares), 2021 = 670,000 acres, 2020 = 695,000 acres
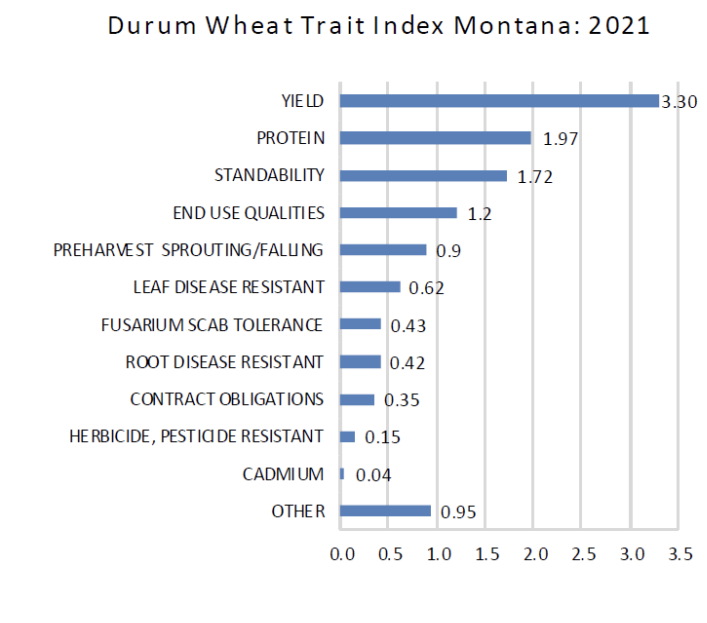
Figure 1. Durum wheat trait index where growers were asked to rank traits in order of importance when choosing a wheat variety for 2021 where 5.00 is the highest and 1.00 is the lowest (from the 2021 MWBC wheat variety survey conducted by the National Agriculutral Statistics Service).
Table 2. Agronomic Evaluation All Dryland State Durum Trials 12 location-years (2020-21)
ID |
Yield1 (bu/ac) |
Test weight (lb/bu) |
Protein2 (%) |
Plant height (inches) |
Heading Date (Julian) |
Mountrail |
51.9* | 59.5 | 15.3 | 30.5 | 179.0 |
Grenora |
51.6* | 59.7 | 15.1 | 29.7 | 178.5 |
Divide |
50.3 | 60.2 | 15.3 | 31.8 | 178.9 |
Tioga |
50.1 | 60.3 | 15.5 | 33.2 | 179.0 |
Carpio |
51.8* | 59.0 | 15.5 | 31.2 | 180.4 |
Joppa |
50.4 | 60.4 | 15.0 | 31.8 | 178.9 |
ND-Riveland |
52.5* | 59.8 | 15.4 | 32.5 | 179.3 |
ND-Grano |
51.6* | 60.4 | 16.1* | 30.7 | 180.2 |
CDC-Vivid |
50.2 | 60.0 | 15.6 | 31.2 | 179.1 |
Lustre |
51.8* | 58.8 | 15.6 | 31.1 | 179.3 |
MTD18155 |
50.9 | 59.6 | 15.0 | 28.8 | 179.0 |
MTD16001 |
48.9 | 59.2 | 15.2 | 31.2 | 179.0 |
MTD16002 |
53.0* | 59.6 | 15.9 | 32.7 | 180.3 |
MTD18213 |
49.6 | 58.0 | 15.3 | 32.5 | 181.1 |
MTD18486 |
49.5 | 59.9 | 15.7 | 32.1 | 183.0** |
MTD18413 |
52.5* | 59.8 | 15.7 | 31.0 | 178.2 |
MTD18348 |
54.8** | 59.9 | 15.3 | 32.8 | 180.3 |
MTD18091 |
49.4 | 59.3 | 15.7 | 31.3 | 180.4 |
MTD18430 |
47.9 | 57.8 | 15.7 | 34.7** | 182.7* |
MTD18179 |
48.6 | 57.8 | 16.4** | 29.9 | 178.6 |
MTD18172 |
54.1* | 60.8 | 15.8 | 31.1 | 180.3 |
MTD18067 |
50.8 | 59.2 | 15.3 | 31.3 | 179.7 |
MTD18381 |
46.0 | 59.5 | 15.5 | 29.6 | 177.3 |
MTD18181 |
46.5 | 59.5 | 16.2* | 32.3 | 181.9 |
MTD18256 |
52.0 | 59.8 | 15.8 | 32.1 | 181.0 |
MTD18217 |
50.2 | 59.4 | 15.4 | 32.6 | 182.5* |
MTD18266 |
51.6* | 60.7 | 16.0* | 31.7 | 181.0 |
MTD18148 |
50.9 | 60.3 | 15.2 | 23.5 | 178.0 |
MTD18313 |
52.8* | 62.0** | 15.2 | 24.7 | 175.6 |
Average |
50.8 | 59.7 | 15.5 | 30.8 | 179.6 |
LSD (0.05) |
3.5 | 0.5 | 0.4 | 1.2 | 0.7 |
Prob > F |
<0.001 | <0.001 | <0.001 | <0.001 | <0.001 |
CV (%) |
8.7 | 1.0 | 3.2 | 4.7 | 0.4 |
1Grain yield reported on a 13% moisture basis
2 Grain protein reported on a 12% moisture basis
** Indicates highest numerical value within a column
* Indicates lines equal to the highest entry based on Fisher's Protected LSD at the
0.05 probability level
Table 3. Yield Evaluations State Durum Trials 2020-2021; 16 location years (2020-2021)
|
|
All Locations Yield (bu/ac)1 |
Dryland Yield (bu/ac)1 |
||||
ID |
2 Year |
2020 |
2020 |
2 Year |
2020 |
2021 |
Mountrail |
66.4* | 77.3* | 55.6* | 51.9* | 62.3* | 41.5 |
Grenora |
65.3* | 72.8* | 57.9* | 51.6* | 60.0* | 43.2 |
Divide |
64.0 | 74.3* | 53.8 | 50.3 | 59.8* | 40.7 |
Tioga |
63.5 | 74.2* | 52.9 | 50.1 | 60.2* | 39.9 |
Carpio |
66.0* | 76.0* | 56.0* | 51.8* | 60.4* | 43.3 |
Joppa |
65.2* | 74.7* | 55.8* | 50.4 | 60.1* | 40.8 |
ND-Riveland |
66.9* | 75.0* | 58.7* | 52.5 | 61.2* | 43.9 |
ND-Grano |
67.1* | 77.1* | 57.1* | 51.6* | 60.6* | 42.6 |
Alzada |
- | 68.8 | - | - | 54.8 | - |
CDC-Vivid |
63.5 | 73.6* | 53.3 | 50.2 | 61.2* | 39.3 |
Lustre |
65.3* | 77.1* | 53.5 | 51.8* | 63.6* | 40.1 |
MTD18155 |
64.2 | 74.0* | 54.4 | 50.9 | 61.4* | 40.4 |
MTD16001 |
62.8 | 72.8* | 52.8 | 48.9 | 58.2 | 39.6 |
MTD16002 |
66.6* | 77.5** | 55.8* | 53.0* | 64.0** | 42.0 |
MTD18213 |
65.0 | 75.5* | 54.5 | 49.6 | 59.0 | 40.3 |
MTD18486 |
64.2 | 77.1* | 51.4 | 49.5 | 61.9* | 37.2 |
MTD18413 |
66.3* | 74.8* | 57.8* | 52.5 | 60.9* | 44.0 |
MTD18348 |
67.4* | 77.4* | 57.5* | 54.8* | 64.5* | 45.2 |
MTD18091 |
64.0 | 74.1* | 53.9 | 49.4 | 59.4* | 39.4 |
MTD18430 |
60.3 | 71.1 | 49.4 | 47.9 | 58.2 | 37.7 |
MTD18179 |
62.5 | 73.0* | 52.1 | 48.6 | 59.9 | 37.2 |
MTD18172 |
68.6** | 76.8* | 60.4** | 54.1** | 62.4 | 45.9* |
MTD18067 |
66.7 | 75.7* | 57.7* | 50.8 | 60.3 | 41.4 |
MTD18381 |
57.9 | 66.4 | 49.5 | 46 | 54.5 | 37.6 |
MTD18181 |
58.2 | 66.9 | 49.4 | 46.5 | 55.4 | 37.6 |
MTD18256 |
66.0* | 75.4* | 56.6* | 52.0** | 61.6* | 42.4 |
MTD18217 |
64.8 | 74.6* | 55.1 | 50.2 | 58.6 | 41.8 |
MTD18266 |
65.7* | 76.7* | 54.8 | 51.6* | 61.7* | 41.6 |
MTD18148 |
63.9 | 74.2* | 53.6 | 50.9 | 61.8* | 40.0 |
MTD18313 |
65.1* | 75.9* | 54.3 | 52.8* | 64.0* | 41.6 |
Average |
64.4 | 74.4 | 54.7 | 50.8 | 60.5 | 41.0 |
LSD (0.05) |
3.6 | 5.1 | 4.9 | 3.5 | 5.1 | 5.2 |
Prob > F |
<0.001 | <0.001 | <0.001 | <0.001 | 0.043 | 0.063 |
CV (%) |
7.8 | 7.0 | 9.1 | 8.7 | 7.4 | 11.1 |
n |
16 | 8 | 8 | 12 | 6 | 6 |
1Grain yield reported on a 13% moisture basis
** Indicates highest numerical value within a column
* Indicates lines equal to the highest entry based on Fisher's Protected LSD at the
0.05 probability level
Table 4. Agronomic Data EARC Dryland On-Station 2 Year 2020-2021
ID |
Yield1 (bu/ac) |
Test weight (lb/bu) |
Protein2 (%) |
Plant height (inches) |
Mountrail |
48.1 | 60.3 | 15.4 | 25.7 |
Grenora |
44.1 | 61.1 | 15.0 | 25.6 |
Divide |
41.8 | 61.6 | 15.5 | 27.1 |
Tioga |
41.3 | 61.9 | 15.6 | 28.4* |
Carpio |
44.0 | 61.4 | 15.7 | 26.4 |
Joppa |
41.4 | 61.7 | 15.4 | 27.0 |
ND-Riveland |
45.4 | 61.6 | 15.7 | 28.6* |
ND-Grano |
41.5 | 62.0 | 15.7 | 26.4 |
CDC-Vivid |
44.0 | 61.1 | 16.3* | 25.8 |
Lustre |
43.2 | 60.0 | 16.2* | 26.5 |
MTD18155 |
44.0 | 61.2 | 15.7 | 25.0 |
MTD16001 |
42.1 | 60.7 | 15.0 | 27.2 |
MTD16002 |
44.9 | 61.6 | 15.4 | 28.1* |
MTD18213 |
42.3 | 60.0 | 16.2* | 27.4 |
MTD18486 |
40.4 | 62.2 | 15.9* | 26.8 |
MTD18413 |
45.0 | 61.6 | 15.7 | 26.7 |
MTD18348 |
50.5** | 61.3 | 15.2 | 28.8* |
MTD18091 |
40.3 | 61.0 | 16.3* | 26.4 |
MTD18430 |
39.7 | 59.3 | 16.3* | 29.7** |
MTD18179 |
38.7 | 58.7 | 16.8** | 26.1 |
MTD18172 |
44.5 | 62.4* | 16.2* | 26.6 |
MTD18067 |
42.7 | 60.7 | 15.7 | 26.3 |
MTD18381 |
39.3 | 60.5 | 15.0 | 25.4 |
MTD18181 |
36.6 | 61.5 | 16.4* | 27.3 |
MTD18256 |
46.6 | 61.0 | 15.8 | 28.3* |
MTD18217 |
43.0 | 61.2 | 16.3* | 27.3 |
MTD18266 |
44.0 | 62.0 | 16.7* | 26.8 |
MTD18148 |
44.0 | 61.3 | 15.1 | 21.2 |
MTD18313 |
43.1 | 63.2* | 15.2 | 21.2 |
Average |
43.0 | 61.2 | 15.8 | 26.6 |
LSD (0.05) |
6.2 | 0.9 | 1.0 | 2.1 |
Prob > F |
0.070 | <0.001 | 0.013 | <0.001 |
CV (%) |
7.1 | 0.7 | 3.0 | 3.9 |
1Grain yield reported on a 13% moisture basis
2 Grain protein reported on a 12% moisture basis
** Indicates highest numerical value within a column
* Indicates lines equal to the highest entry based on Fisher's Protected LSD at the
0.05 probability level
Table 5. Agronomic Data EARC Dagmar Dryland Off-Station 2021 Durum Variety Trial
ID |
Yield1 (bu/ac) |
Test weight (lb/bu) |
Protein2 (%) |
Plant height (inches) |
Mountrail |
16.1 | 63.1 | 17.3 | 19.8* |
Grenora |
19.3 | 63.2 | 16.5 | 18.8 |
Divide |
19.5 | 63.6 | 16.6 | 21.0* |
Tioga |
19.1 | 63.6 | 17.2* | 22.4** |
Carpio |
17.8 | 63.1 | 16.5 | 19.3* |
Joppa |
18.5 | 64.0* | 16.5 | 20.3* |
ND-Riveland |
22.1 | 63.8 | 16.4 | 22.2 |
ND-Grano |
16.2 | 63.8 | 17.4* | 19.8* |
CDC-Vivid |
18.4 | 63.9* | 18.2* | 22.0* |
Lustre |
16.1 | 62.4 | 17.9* | 17.2 |
MTD16001 |
18.6 | 63.2 | 16.2* | 19.4* |
MTD16002 |
20.5 | 63.5 | 16 | 20.9* |
MTD18348 |
24.8** | 63.5 | 16 | 22.6* |
MTD18313 |
16.1 | 64.9** | 17.2* | 17.3 |
Average |
18.7 | 63.5 | 16.8 | 20.1 |
LSD (0.05) |
6.6 | 1.0 | 1.0 | 3.0 |
Prob > F |
0.371 | 0.016 | 0.002 | 0.008 |
CV (%) |
21.0 | 1.0 | 3.6 | 9.0 |
1Grain yield reported on a 13% moisture basis
2 Grain protein reported on a 12% moisture basis
** Indicates highest numerical value within a column
* Indicates lines equal to the highest entry based on Fisher's Protected LSD at the
0.05 probability level
Table 6. Agronomic Data Loring Dryland Off-Station 2021 State Durum Trial
ID |
Yield1 (bu/ac) |
Test weight (lb/bu) |
Protein2 (%) |
Plant height (inches) |
Sawfly3 (%) |
Falling Number (seconds) |
Mountrail |
26.6 | 58.4 | 16.2 | 20.3 | 2.3 | 415.4 |
Grenora |
26.3 | 58.9 | 15.6 | 20.8 | 8.3* | 289.7 |
Divide |
22.9 | 59.6 | 16.0 | 21.3 | 8.3* | 406.4 |
Tioga |
25.5 | 59.6 | 16.1 | 23.1* | 2.3 | 385.4 |
Carpio |
27.0 | 58.7 | 15.5 | 21.6 | 1.0 | 429.4 |
Joppa |
24.7 | 59.9 | 15.9 | 22.3* | 2.3 | 428.5 |
ND-Riveland |
24.8 | 59.1 | 16.0 | 23.2* | 1.0 | 467.2* |
ND-Grano |
27.3* | 59.8 | 16.3 | 20.9 | 2.3 | 443.0 |
CDC-Vivid |
23.9 | 59.5 | 16.9** | 22.1 | 8.3** | 457.3* |
Lustre |
24.1 | 58.0 | 16.3 | 21.7 | 3.7 | 471.5** |
MTD16001 |
23.7 | 59.4 | 15.9 | 19.9 | 2.3 | 440.0 |
MTD16002 |
22.8 | 59.4 | 16.1 | 23.8** | 3.7 | 459.8* |
MTD18348 |
29.3** | 59.1 | 15.5 | 21.9 | 2.3 | 462.5* |
MTD18313 |
28.1* | 62.0** | 15.8 | 19.9 | 3.7 | 461.5* |
Average |
25.7 | 59.4 | 16.0 | 21.5 | 3.7 | 436.9 |
LSD (0.05) |
2.0 | 0.4 | 0.3 | 1.6 | 3.5 | 18.7 |
Prob > F |
<0.001 | <0.001 | <0.001 | <0.001 | <0.001 | <0.001 |
CV (%) |
4.7 | 0.4 | 1.2 | 4.5 | 57.2 | 2.6 |
1Grain yield reported on a 13% moisture basis
2 Grain protein reported on a 12% moisture basis
** Indicates highest numerical value within a column
* Indicates lines equal to the highest entry based on Fisher's Protected LSD at the
0.05 probability level
Table 7. Agronomic Data Chester Dryland Off-Station 2021 State Durum Trial
ID |
Yield1 (bu/ac) |
Test weight (lb/bu) |
Protein2 (%) |
Plant height (inches) |
Sawfly3 (%) |
Falling Number (seconds) |
Mountrail |
22.3 | 55.4 | 17.1 | 23.0 | 5.3 | 189.1 |
Grenora |
26.3* | 55.0 | 16.3 | 22.6 | 3.7 | 106.5 |
Divide |
24.6 | 56.3 | 16.7 | 25.2* | 1.0 | 209.3 |
Tioga |
20.2 | 56.1 | 17.4* | 25.7** | 5.3 | 92.3 |
Carpio |
23.2 | 54.4 | 17.1 | 24.1 | 0.7 | 201.4 |
Joppa |
21.8 | 56.4 | 16.9 | 24.0 | 5.3 | 163.2 |
ND-Riveland |
24.0 | 56.8 | 16.9 | 24.5* | 1.0 | 224.1* |
ND-Grano |
22.1 | 56.1 | 16.8 | 22.2 | 10.0** | 168.7 |
CDC-Vivid |
25.2* | 56.7 | 17.0 | 22.9 | 2.3 | 142.5 |
Lustre |
21.1 | 55.0 | 17.6** | 25.2 | 1.0 | 185.8 |
MTD16001 |
26.9* | 56.1 | 16.4 | 24.3* | 1.0 | 205.9 |
MTD16002 |
19.9 | 55.5 | 17.4* | 24.0 | 1.8 | 202.9 |
MTD18348 |
26.3* | 57.4 | 16.2 | 25.0* | 2.3 | 150.2 |
MTD18313 |
27.9** | 58.6** | 16.4 | 20.6 | 0.5 | 242.1** |
Average |
23.8 | 56.1 | 16.8 | 23.7 | 3.2 | 171.6 |
LSD (0.05) |
2.7 | 0.6 | 0.4 | 1.6 | 4.2 | 24.4 |
Prob > F |
<0.001 | <0.001 | <0.001 | <0.001 | <0.001 | <0.001 |
CV (%) |
6.3 | 0.6 | 1.2 | 3.7 | 74.9 | 7.9 |
1Grain yield reported on a 13% moisture basis
2 Grain protein reported on a 12% moisture basis
** Indicates highest numerical value within a column
* Indicates lines equal to the highest entry based on Fisher's Protected LSD at the
0.05 probability level
Table 8. Durum Seed Quality Evaluation I 16 location-years (2020-2021)
ID |
Test weight (lb/bu)1 |
Grain Protein2 (%) |
Grain Ash3 (%) |
Falling Number (seconds) |
Mountrail |
59.9 | 14.7 | 1.55 | 458.9 |
Grenora |
60.3 | 14.5 | 1.57 | 464.9 |
Divide |
60.5 | 14.5 | 1.50 | 450.4 |
Tioga |
60.6 | 15.0 | 1.56 | 419.6 |
Carpio |
59.7 | 14.9 | 1.55 | 454.5 |
Joppa |
60.8 | 14.3 | 1.52 | 434.0 |
ND-Riveland |
60.2 | 14.8 | 1.55 | 479.7 |
ND-Grano |
60.9 | 14.7 | 1.54 | 444.1 |
Alzada4 |
60.1 | 14.3 | 1.56 | 556.2** |
CDC-Vivid |
60.5 | 15.5* | 1.54 | 458.2 |
Lustre |
59.2 | 15.0 | 1.51 | 472.0 |
MTD18155 |
60.1 | 15.1 | 1.56 | 413.9 |
MTD16001 |
59.5 | 14.2 | 1.51 | 458.2 |
MTD16002 |
60.1 | 14.5 | 1.48 | 480.1 |
MTD18213 |
58.7 | 15.0 | 1.59* | 498.1 |
MTD18486 |
60.8 | 14.6 | 1.56 | 447.2 |
MTD18413 |
60.3 | 15.1 | 1.52 | 415.6 |
MTD18348 |
60.5 | 14.8 | 1.56 | 481.6 |
MTD18091 |
60.1 | 14.8 | 1.55 | 446.9 |
MTD18430 |
58.6 | 15.1 | 1.60* | 492.6 |
MTD18179 |
58.2 | 15.6* | 1.56 | 455.7 |
MTD18172 |
61.4 | 15.1 | 1.52 | 414.2 |
MTD18067 |
59.9 | 14.5 | 1.55 | 411.3 |
MTD18381 |
59.9 | 14.9 | 1.57 | 459.5 |
MTD18181 |
60.3 | 15.6** | 1.54 | 448.5 |
MTD18256 |
60.2 | 15.2 | 1.61** | 463.8 |
MTD18217 |
60.1 | 14.7 | 1.56 | 454.7 |
MTD18266 |
60.1 | 15.3** | 1.57 | 462.4 |
MTD18148 |
60.3 | 14.9 | 1.55 | 526.2 |
MTD18313 |
62.1** | 14.8 | 1.53 | 449.9 |
Average |
60.2 | 14.9 | 1.55 | 459.1 |
LSD (0.05) |
0.5 | 0.4 | 0.04 | 21.7 |
Prob > F |
<0.001 | <0.001 | <0.001 | <0.001 |
CV (%) |
1.2 | 3.7 | 3.2 | 6.5 |
1n = 15
2 Grain yield reported on a 13% moisture basis
3Grain protein reported on a 12% moisture basis
4Alzada data n = 8 (2020 only)
** Indicates highest numerical value within a column
* Indicates lines equal to the highest entry based on Fisher's Protected LSD at the
0.05 probability level
Table 9. Durum Seed Quality Evaluation II 16 location-years (2020-2021)
ID |
Large Seeds1 (%) |
Small Seeds2 (%) |
Hardness1,2 (%) |
Individual Seed Weight1,2 (mg) |
Individual Seed Diameter 1,2 (mm) |
Mountrail |
39.4 | 18.7* | 72.4 | 38.3 | 2.76 |
Grenora |
48.3 | 15.0 | 75.6 | 39.4 | 2.80 |
Divide |
51.1 | 13.8 | 73.7 | 39.0 | 2.79 |
Tioga |
54.9 | 12.7 | 71.8 | 40.4* | 2.86 |
Carpio |
50.9 | 14.3 | 73.3 | 37.9 | 2.76 |
Joppa |
44.1 | 16.6* | 73.9 | 39.3 | 2.78 |
ND-Riveland |
56.1 | 10.9 | 71.9 | 40.9* | 2.83 |
ND-Grano |
44.0 | 17.5* | 74.4 | 37.8 | 2.76 |
Alzada4 |
64.0* | 10.3 | 70.8 | 41.8* | 2.96* |
CDC-Vivid |
55.0 | 12.2 | 77.2 | 38.1 | 2.77 |
Lustre |
37.7 | 17.6* | 74.0 | 37.7 | 2.74 |
MTD18155 |
56.7 | 10.9 | 76.5 | 38.3 | 2.85 |
MTD16001 |
41.1 | 17.9* | 75.7 | 37.6 | 2.74 |
MTD16002 |
40.9 | 17.5* | 80.1* | 35.6 | 2.73 |
MTD18213 |
52.1 | 15.0 | 70.2 | 39.4 | 2.74 |
MTD18486 |
64.5* | 9.2 | 76.4 | 39.0 | 2.83 |
MTD18413 |
59.2 | 10.2 | 73.0 | 39.4 | 2.81 |
MTD18348 |
65.3** | 8.1 | 73.3 | 41.0* | 2.89 |
MTD18091 |
42.8 | 19.0** | 75.8 | 36.3 | 2.72 |
MTD18430 |
47.7 | 14.5 | 75.0 | 37.8 | 2.74 |
MTD18179 |
43.2 | 17.3* | 77.8 | 35.8 | 2.71 |
MTD18172 |
62.1* | 8.9 | 75.2 | 40.3 | 2.87 |
MTD18067 |
48.9 | 13.7 | 73.3 | 40.6* | 2.83 |
MTD18381 |
49.8 | 13.0 | 75.8 | 37.8 | 2.81 |
MTD18181 |
49.0 | 13.2 | 77.3 | 37.9 | 2.79 |
MTD18256 |
53.0 | 12.5 | 75.7 | 38.9 | 2.82 |
MTD18217 |
62.0* | 9.7 | 71.4 | 40.0 | 2.83 |
MTD18266 |
55.3 | 10.6 | 77.0 | 39.8 | 2.83 |
MTD18148 |
47.3 | 14.3 | 79.8* | 37.5 | 2.79 |
MTD18313 |
55.3 | 11.7 | 80.5** | 37.1 | 2.83 |
Average |
51.4 | 13.6 | 75.0 | 38.7 | 2.80 |
LSD (0.05) |
4.7 | 2.7 | 1.8 | 1,1 | 0.04 |
Prob > F |
<0.001 | <0.001 | <0.001 | <0.001 | <0.001 |
CV (%) |
12.7 | 27.6 | 3.3 | 4.1 | 2.2 |
1n = 15
2 Determined using the single kernel characterization system
3Alzada data n = 8 (2020 only)
** Indicates highest numerical value within a column
* Indicates lines equal to the highest entry based on Fisher's Protected LSD at the
0.05 probability level
Table 10. Durum Semolina Quality Evaluation I 16 location-years (2020-2021)
ID |
Bran1 (%) |
Shorts2 (%) |
Semolina1 (%) |
Semolina Protein2 (%) |
Semolina Ash2 (%) |
Mountrail |
26.7 | 12.1 | 61.2* | 13.6 | 0.66 |
Grenora |
27.8 | 12.7 | 59.5 | 13.1 | 0.65 |
Divide |
27.0 | 12.1 | 60.8 | 13.2 | 0.62 |
Tioga |
26.4 | 12.1 | 61.5* | 13.6 | 0.63 |
Carpio |
27.1 | 12.9 | 60.0 | 13.5 | 0.66 |
Joppa |
26.6 | 12.2 | 61.2* | 13.0 | 0.63 |
ND-Riveland |
28.7** | 13.4 | 57.9 | 13.2 | 0.64 |
ND-Grano |
26.6 | 12.0 | 61.4* | 13.3 | 0.63 |
Alzada4 |
25.0 | 14.1** | 60.9* | 13.0 | 0.68** |
CDC-Vivid |
27.0 | 13.5 | 59.5 | 14.0* | 0.68* |
Lustre |
27.0 | 12.8 | 60.2 | 13.7 | 0.65 |
MTD18155 |
27.2 | 12.7 | 60.1 | 13.7 | 0.63 |
MTD16001 |
26.9 | 12.4 | 60.7 | 12.9 | 0.62 |
MTD16002 |
27.6 | 12.5 | 59.8 | 13.3 | 0.61 |
MTD18213 |
28.5* | 12.5 | 59.0 | 13.7 | 0.67 |
MTD18486 |
27.9 | 13.1 | 58.9 | 13.2 | 0.68 |
MTD18413 |
28.3* | 12.2 | 59.5 | 13.6 | 0.63 |
MTD18348 |
26.6 | 12.5 | 60.9* | 13.1 | 0.66 |
MTD18091 |
27.2 | 12.3 | 60.5 | 13.6 | 0.67* |
MTD18430 |
28.0 | 13.3 | 58.7 | 13.9* |
0.68* |
MTD18179 |
28.5* | 13.0 | 58.5 | 14.2** | 0.64 |
MTD18172 |
26.3 | 12.4 | 61.2* | 13.7 | 0.60 |
MTD18067 |
26.6 | 11.9 | 61.5* | 13.3 | 0.65 |
MTD18381 |
25.9 | 12.6 | 61.5** | 13.5 | 0.66 |
MTD18181 |
27.7 | 12.0 | 60.3 | 14.0* | 0.58 |
MTD18256 |
27.4 | 13.0 | 59.6 | 13.7 | 0.67* |
MTD18217 |
26.3 | 12.5 | 61.2* | 13.3 | 0.65 |
MTD18266 |
26.7 | 13.5 | 59.7 | 13.9* | 0.66 |
MTD18148 |
26.6 | 13.7* | 59.7 | 13.7 | 0.67* |
MTD18313 |
26.0 | 12.9 | 61.1* | 13.2 | 0.61 |
Average |
27.1 | 12.7 | 60.2 | 13.5 | 0.65 |
LSD (0.05) |
0.5 | 0.3 | 0.7 | 0.4 | 0.07 |
Prob > F |
<0.001 | <0.001 | <0.001 | <0.001 | <0.001 |
CV (%) |
2.8 | 3.6 | 1.6 | 4.1 | 3.9 |
1Milling fractions from Quadramat Brabender Jr. milling separated with a U.S. #35 Sieve
2 Semolina protein and ash reported on a 14% moisture basis
3Alzada data n = 8 (2020 only)
** Indicates highest numerical value within a column
* Indicates lines equal to the highest entry based on Fisher's Protected LSD at the
0.05 probability level
Table 11. Durum Semolina Quality Evaluation II 16 location-years (2020-2021)
ID |
CIELAB Color Space1 |
Mix Time (minutes) |
Max Integral Peak2 (%TQ) |
Gluten Index3 |
||
L* |
b* |
a* |
||||
Mountrail |
85.0 | 26.9 | -2.65** | 2.2 | 102.5 | 34.2 |
Grenora |
85.0 | 30.2 | -3.04 | 3.0 | 14.23 | 64.7 |
Divide |
84.9 | 28.8 | -2.82 | 3.3 | 154.6 | 78.5 |
Tioga |
84.7 | 30.5 | -2.94 | 3.7 | 175.9 | 84.0 |
Carpio |
84.7 | 31.7 | -3.23 | 4.2 | 217.0 | 97.2* |
Joppa |
84.8 | 31.2 | -3.02 | 3.9 | 177.3 | 88.7 |
ND-Riveland |
84.8 | 31.4 | -3.16 | 4.0 | 201.7 | 92.5* |
ND-Grano |
84.9 | 31.6 | -3.25 | 3.3 | 159.0 | 82.7 |
Alzada4 |
84.2 | 31.8 | -2.84 | 4.0 | 206.6 | 97.9*** |
CDC-Vivid |
84.2 | 32.8 | -2.97 | 5.1** | 228.8* | 90.0* |
Lustre |
84.6 | 29.7 | -2.70* | 3.2 | 150.7 | 64.2 |
MTD18155 |
84.8 | 28.5 | -2.80 | 3.9 | 172.0 | 72.0 |
MTD16001 |
84.9 | 29.4 | -2.87 | 3.2 | 157.9 | 69.2 |
MTD16002 |
84.7 | 28.8 | -2.83 | 2.8 | 132.3 | 48.7 |
MTD18213 |
84.4 | 33.7** | -2.27 | 3.3 | 167.0 | 82.5 |
MTD18486 |
84.5 | 32.9 | -3.18 | 4.7 | 232.9** | 94.2* |
MTD18413 |
84.9 | 28.5 | -2.83 | 3.5 | 169.7 | 86.2 |
MTD18348 |
84.7 | 31.8 | -3.16 | 4.6 | 228.8* | 96.0* |
MTD18091 |
84.9 | 30.8 | -3.19 | 3.3 | 164.7 | 87.0 |
MTD18430 |
84.7 | 31.0 | -3.22 | 3.8 | 197.9 |
90.5* |
MTD18179 |
84.3 | 32.2 | -3.03 | 4.5 | 209.7 | 85.2 |
MTD18172 |
85.3** | 27.1 | -2.84 | 2.8 | 126.1 | 59.0 |
MTD18067 |
85.0 | 29.2 | -2.94 | 3.4 | 163.1 | 86.0 |
MTD18381 |
84.8 | 30.6 | -3.09 | 3.4 | 154.7 | 68.7 |
MTD18181 |
84.6 | 31.9 | -3.05 | 3.9 | 193.7 | 89.0 |
MTD18256 |
84.5 | 31.1 | -3.00 | 4.3 | 203.5 | 82.7 |
MTD18217 |
84.8 | 31.7 | -3.25 | 4.5 | 222.9* | 95.5* |
MTD18266 |
84.8 | 29.8 | -2.99 | 3.3 | 158.2 | 69.7 |
MTD18148 |
84.2 | 31.9 | -2.86 | 4.3 | 204.0 | 95.0* |
MTD18313 |
84.6 | 29.4 | -2.77 | 3.9 | 172.2 | 71.8 |
Average |
84.7 | 30.6 | -2.99 | 3.7 | 178.3 | 80.1 |
LSD (0.05) |
0.2 | 0.5 | 0.089 | 0.2 | 12.5 | 7.7 |
Prob > F |
<0.001 | <0.001 | <0.001 | <0.001 | <0.001 | <0.001 |
CV (%) |
0.3 | 2.5 | 4.2 | 4.2 | 9.9 | 6.7 |
1CIELAB color space L* = whiteness, b* = yellowness, a* = redness
2 Mixograph midline analysis
3Data from two environments only
4Alzada data n = 8 (2020 only)
** Indicates highest numerical value within a column
* Indicates lines equal to the highest entry based on Fisher's Protected LSD at the
0.05 probability level
Table 12. Durum Fusarium Head Blight Evaluation I 2021 (Dr. Frankie Crutcher, EARC, Sidney, MT)
ID |
Severity1 (%) |
Incidence2 (%) |
Index 3 (%) |
FDK4 (%) |
Yield (bu/ac) |
Mountrail |
34.8 AB | 92.2 | 32.3 AB | 16.7 | 31.4 AB |
Grenora |
21.6 AB | 72.2 | 15.8 | 10.0 B | 32.0 AB |
Divide |
28.4 AB | 88.9 | 25.3 AB | 21.7 AB | 33.7 AB |
Tioga |
21.6 B | 85.6 | 18.8 AB | 15.0 AB | 36.0 AB |
Carpio |
26.7 AB | 83.3 | 22.3 AB | 25.0 AB | 37.5 AB |
Joppa |
19.9 B | 81.1 | 16.3 B | 18.3 AB | 43.0 AB |
ND-Riveland |
15.1 B | 83.3 | 12.6 B | 13.3 AB | 36.1 AB |
ND-Grano |
18.9 B | 82.2 | 16.2 B | 13.3 AB | 36.1 AB |
CDC-Vivid |
33.9 AB | 94.4 | 32.1 | 26.7 AB | 32.8 AB |
Lustre |
27.4 AB | 75.6 | 21.9 AB | 16.7 AB | 31.9 AB |
MTD18155 |
25.8 AB | 90 | 23.9 AB | 16.7 AB | 35.3 AB |
MTD16001 |
26.3 AB | 82.2 | 22.3 AB | 11.7 AB | 35.5 AB |
MTD16002 |
28.6 AB | 78.9 | 22.9 AB | 18.3 AB | 33.6 AB |
MTD18213 |
22.9 B | 80 | 18.7 AB | 23.3 AB | 40.3 AB |
MTD18486 |
20.0 B | 78.9 | 16.3 B | 33.3 AB | 27.2 AB |
MTD18413 |
17.1 B | 78.9 | 13.7 B | 21.7 AB | 40.6 AB |
MTD18348 |
23.4 B | 86.7 | 20.3 AB | 26.7 AB | 35.2 AB |
MTD18091 |
24.0 B | 88.9 | 21.4 AB | 21.7 AB | 37.1 AB |
MTD18430 |
23.0 B | 71.1 | 16.5 B | 36.7 AB | 31.1 AB |
MTD18179 |
34.7 AB | 90 | 31.4 AB | 26.7 AB | 35.6 AB |
MTD18172 |
34.3 AB | 90 | 31.1 AB | 30.0 AB | 24.5 AB |
MTD18067 |
23.6 B | 88.9 | 20.9 AB | 35.0 AB | 27.6 AB |
MTD18381 |
49.0 A | 88.9 | 43.4 A | 20.0 AB | 23.4 AB |
MTD18181 |
28.8 AB | 86.7 | 25.0 AB | 25.0 AB | 23.6 AB |
MTD18256 |
20.6 B | 82.2 | 16.9 B | 16.7 AB | 33.9 AB |
MTD18217 |
13.5 B | 70 | 16.9 B | 16.7 AB | 33.9 AB |
MTD18266 |
17.9 B | 76.7 | 14.0 B | 25.0 AB | 38.6 AB |
MTD18148 |
27.8 AB | 86.7 | 25.1 AB | 28.3 AB | 21.5 B |
MTD18313 |
27.2 AB | 90 | 24.8 AB | 43.3 A | 32.4 AB |
Average |
25.2 | 83.5 | 21.6 | 22.5 | 33.5 |
LSD (0.05) |
<0.001 | 0.160 | 0.001 | 0.030 | 0.040 |
Prob > F |
37 | 12 | 44.1 | 50.9 | 25.2 |
CV (%) |
23.5 | N/A | 25.1 | 32.7 | 24.4 |
1Pest Severity: Average percent area of head covered by disease. Thirty heads were
evaluated per plot
2 Pest Incidence: Percent of thirty plants per plot that had visible FHB symptoms
3Index: Severity X incidence / 100
4Percent of Fusarium diseased kernels
5Letters in common did not differ significantly using a Tukey's HSD test at a significance
level of 5%
Table 13. Durum Stem Rust Evaluation 2021 (Dr. Li Huang, MSU, Bozeman, MT)
ID |
Infection Type1 |
Level of Reaction |
Mountrail |
; | R |
Grenora |
;1= | R |
Divide |
1=1C | R |
Tioga |
1= | R |
Carpio |
; | R |
Joppa |
1=~2C | R~MR |
ND-Riveland |
1= | R |
ND-Grano |
; | R |
CDC-Vivid |
1=1+C |
R |
Lustre |
1=1+C | R |
MTD18155 |
1=2C | R |
MTD16001 |
1= | R |
MTD16002 |
2-C | MR |
MTD18213 |
;1+C | R |
MTD18486 |
1= | R |
MTD18413 |
1=C | R |
MTD18348 |
1- | R |
MTD18091 |
1= | R |
MTD18430 |
1-C~2C | R~MR |
MTD18179 |
1=C | R |
MTD18172 |
12C | R |
MTD18067 |
1=C | R |
MTD18381 |
1-2+C | R |
MTD18181 |
2C | MR |
MTD18256 |
23-C | MS |
MTD18217 |
1-C | R |
MTD18266 |
12C | MR |
MTD18148 |
1-C | R |
MTD18313 |
1-C | R |
1Inoculated with Puccinia graminis isolate TPMKS on 4/19/2021 scored 5/3/2021
0 = Immune (R), ";" = Very Resistant (VR), 1 = Resistant (R), 2 = Moderately resistant
(MR),
3 = Moderately susceptible (MS), 4 = Susceptible (S), Chlorosis (C). Variations are
given by + and = to indicate more or less than usual
Table 14. Durum Fungal Leaf Spot Evaluation 2021 (Dr. Zhaohui Liu, NDSU, Fargo, ND)
ID |
Ptr ToxA1 |
Ptr Race 12 |
Ptr Race 52 |
Sn4 |
Mountrail |
ND | 3.0 | 2.0 | 2.0 |
Grenora |
1 | 3.0 | 2.0 | 2.0 |
Divide |
1 | 2.5 | 1.5 | 3.0 |
Tioga |
1 | 1.5 | 1.5 | 1.0 |
Carpio |
1 | 2.0 | 1.5 | 2.5 |
Joppa |
1 | 3.5 | 3.5 | 3.0 |
ND-Riveland |
0 | 2.5 | 2.5 | 2.0 |
ND-Grano |
1 | 2.5 | 2.0 | 3.0 |
CDC-Vivid |
1 | 1.5 | 2.0 | 3.5 |
Lustre |
1 | 1.0 | 1.0 | 2.5 |
MTD18155 |
1 | 2.0 | 1.0 | 2.0 |
MTD16001 |
0 | 3.5 | 2.5 | 1.5 |
MTD16002 |
0 | 1.5 | 2.5 | 1.5 |
MTD18213 |
1 | 2.0 | 2.0 | 2.5 |
MTD18486 |
1 | 3.5 | 3.0 | 1.0 |
MTD18413 |
ND | 1.5 | 1.5 | 2.5 |
MTD18348 |
1 | 1.0 | 3.0 | 2.0 |
MTD18091 |
1 | 2.5 | 2.5 | 2.0 |
MTD18430 |
0 | 1.0 | ND | 1.0 |
MTD18179 |
ND | 1.0 | ND | 1.0 |
MTD18172 |
1 | 3.0 | 3.0 | 2.5 |
MTD18067 |
1 | 2.0 | 1.5 | 2.5 |
MTD18381 |
1 | 1.5 | 3.0 | 2.0 |
MTD18181 |
ND | ND | ND | 3.0 |
MTD18256 |
1 | 2.5 | 2.5 | 3.0 |
MTD18217 |
1 | 2.5 | 1.5 | 3.0 |
MTD18266 |
0 | 2.0 | 2.5 | 1.0 |
MTD18148 |
1 | 2.0 | 3.5 | 2.0 |
MTD18313 |
1 | 1.0 | 2.0 | 1.0 |
Salamouni (check) |
0 | 1.5 | 1.0 | 1.0 |
Glenelea (check) |
1 | 4.0 | 2.5 | 4.0 |
1P. tritici-repentis (ptr) ToxA: 0 = intensive; 1 = sensitive, ND = no data. ToxA sensitivity is conferred
by wheat Tsn1
2Evaluation with Ptr races 1 (predominant in North dakota) and 5 using a 0-5 scale,
1,2 = resistant, 3 = moderately susceptible, 4, 5 = highly susceptible, ND = no data
3Evaluation with Septoria nodorum isolate Sn4 (predominant in North Dakota) using 0-5 scale, 0-2 = resistant, 3 = moderatly
susceptible, 4,5 = highly susceptible
Table 15. Durum Stripe Rust Evaluation 2021 (Dr. Xianming Chen, USDA-ARS, Pullman, WA)
ID |
Mount Vernon2 |
|||
5/26 |
6/22 |
|||
Fks 33 |
Fks 10.533 |
|||
IT1 |
% |
IT1 |
% |
|
Mountrail |
8 | 80 | 2 | 15 |
Grenora |
8 | 70 | 2 | 10 |
Divide |
5 | 40 | 2 | 10 |
Tioga |
5 | 40 | 2 | 15 |
Carpio |
5 | 40 | 2 | 15 |
Joppa |
8 | 70 | 3 | 20 |
ND-Riveland |
5 | 40 | 3 | 20 |
ND-Grano |
5 | 40 | 2 | 10 |
CDC-Vivid |
5 | 40 | 2 | 10 |
Lustre |
5 | 40 | 2 | 10 |
MTD18155 |
8 | 70 | 3 | 20 |
MTD16001 |
8 | 70 | 3 | 20 |
MTD16002 |
5 | 30 | 2 | 10 |
MTD18213 |
5 | 40 | 2 | 10 |
MTD18486 |
5 | 40 | 2 | 5 |
MTD18413 |
8 | 70 | 5 | 30 |
MTD18348 |
5 | 40 | 5 | 30 |
MTD18091 |
8 | 70 | 5 | 30 |
MTD18430 |
8 | 70 | 2 | 10 |
MTD18179 |
5 | 40 | 2 | 5 |
MTD18172 |
5 | 40 | 2 | 5 |
MTD18067 |
5 | 40 | 3 | 20 |
MTD18381 |
5 | 30 | 3 | 20 |
MTD18181 |
5 | 30 | 2 | 5 |
MTD18256 |
8 | 70 | 2 | 5 |
MTD18217 |
8 | 70 | 2 | 5 |
MTD18266 |
8 | 70 | 2 | 10 |
MTD18148 |
8 | 80 | 3 | 20 |
MTD18313 |
8 | 80 | 8 | 80 |
Alzada (2018) |
5 | 40 | 2 | 15 |
Alzada (2019) |
5 | 40 | 2.8 | 5.80 |
Check |
9 | 80 | 9 | 100 |
Check |
9 | 80 | 9 | 100 |
1Infected with naturally occurring Puccinia striiformis. Infection Type (IT) was recorded based on the 0-9 scale with ITs 8 and 9 combined
as 8 (the most susceptible reaction) in field data. Generally, 0-3 are considered
resistant, 4-6 intermediate, and 7-9 susceptible. Heterogeneous reactions of an entry
were indicated by two or more ITs separated by "," for most plants with the first
IT and few plants with the second IT or connected with "-" for entries containing
plants with continuous ITs
2Entries with a high IT in the first note, but a low IT in the second note at Mt. Vernon
may indicate that they have high-temperature, adult-plant (HTAP) resistance
3Feekes (Fks) scale for wheat growth stages. 3=late tillering, 10.53=flowering