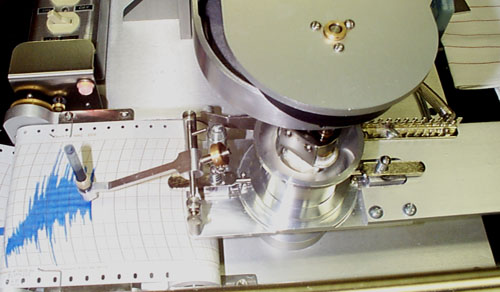
This is a test of the mixing properties of a dough. The quality of a loaf of bread is strongly dependent on the mixing, and for each combination of flour and mixer it is possible to find an optimum stage of dough development. Ten grams of flour on a 14% moisture basis are weighed and mixed at optimum water absorption. As long as there is only flour mixing in the mixograph there is no resistance. When water is added, the dough development starts, and this is seen as an ascending part of the mixing curve. The mixograph curve suggests mixing time requirement, tolerance and optimum water absorption. Depending on the dough strength of the flour, the curve will reach a maximum; either as a well-defined peak or as a plateau. After further mixing, a decrease in the mixing curve is recorded and the breakdown starts. Dough breakdown behavior is reflected in the tail of the curve when mixing continues beyond the mixing peak and is commonly referred to as mixing tolerance. A dough with good mixing tolerance will have a broader "window of opportunity" for a baker to stop the dough at optimum development. Good dough mixing tolerance would also indicate that bread dough should be elastic after mixing. The point of optimum dough development is at the maximum in the mixing curve or slightly after the peak. The rate of breakdown shows the stability of the dough and its sensitivity to mechanical treatment. See Appendix I for an example of a graded mixogram. The mixogram is still an important test in breeders' early generation samples. It tells us if the sample will have good mixing properties and can therefore be screened at a very early stage without actually baking. AACC Method 54-40.
For desirable bread-type flour with adequate flour protein, a mixogram should indicate high water absorption, moderate mixing times (3-6 minutes), strong gluten strength, and good dough mixing tolerance. The mixograms are visually evaluated for correct water absorption, gluten strength and mixing time. Mixogram curves of bread-type flours with undesirable traits (low flour protein, extreme mixing times, poor mixing tolerance, weak gluten strength and low water absorption) are often eliminated from the breeding program.
8.1. Mixing Time
The time in minutes required for optimum dough development. It is the maximum point on the mixing curve or slightly after the peak. Mixogram mixing time is largely a function of protein content and environment. As protein increases, mixing time will decrease. Extremely long mixing time is considered undesirable because the power and time requirements would not be economical for a commercial bakery. Also, extremely long mixing time is often associated with tough, bucky doughs, which do not perform properly in a mechanized bakery. Mixogram mixing time is used to approximate the optimum bread dough mixing time.
8.2. Water Absorption
Optimum flour water absorption is visually evaluated by the swings of the mixogram curve. Absorption is reported as percent by weight, corrected to a 14% flour moisture basis. Mixogram absorption is a function of protein content, variety, flour moisture and environment. Mixogram absorption is used to estimate the bread baking absorption.
8.3. Type
The desirable qualities of good bread wheat are largely associated with the quantity and quality of its protein. The quantity is influenced mainly by environmental factors, but the quality of protein is mainly a heritable characteristic. A high-quality variety produces good bread over a fairly wide range of protein percentages, whereas a low-quality variety may produce relatively poor-quality bread even when its protein content is high. Mixograms are typed according to protein content/quality and tolerance. Protein content/quality is divided into three categories: Low (less than 10%), Medium (10% - 12.9%) and High (13% or greater). The mixogram of an 11% protein flour may be classified as high if the height of the curve reflects that of a flour with a 13% or better protein; meaning the protein in the flour is of a higher quality. Tolerance is scored 1 - 8 (weak to strong). See Appendix II for Mixograph Reference Chart.